Abstract
-
Background
- Point of care ultrasound (POCUS) is being explored for dynamic measurements like inferior vena cava collapsibility index (IVC-CI) and left ventricular outflow tract velocity time integral (LVOT-VTI) to guide anesthesiologists in predicting fluid responsiveness in the preoperative period and in treating post-induction hypotension (PIH) with varying accuracy.
-
Methods
- In this prospective, observational study on included 100 adult patients undergoing elective surgery under general anesthesia, the LVOT-VTI and IVC-CI measurements were performed in the preoperative room 15 minutes prior to surgery, and PIH was measured for 20 minutes in the post-induction period.
-
Results
- The incidence of PIH was 24%. The area under the curve, sensitivity, specificity, positive predictive value, negative predictive value, and diagnostic accuracy of the two techniques at 95% confidence interval was 0.613, 30.4%, 93.3%, 58.3%, 81.4%, 73.6% for IVC-CI and 0.853, 83.3%, 80.3%, 57.1%, 93.8%, 77.4% for LVOT -VTI, respectively. In multivariate analysis, the cutoff value for IVC-CI was >51.5 and for LVOT-VTI it was ≤17.45 for predicting PIH with odd ratio [OR] of 8.491 (P=0.025) for IVCCI and OR of 17.427 (P<0.001) for LVOT. LVOT-VTI assessment was possible in all the patients, while 10% of patients were having poor window for IVC measurements.
-
Conclusions
- We recommend the use of POCUS using LVOT-VTI or IVC-CI to predict PIH, to decrease the morbidity of patients undergoing surgery. Out of these, we recommend LVOT-VTI measurements as it has showed a better diagnostic accuracy (77.4%) with no failure rate.
-
Keywords: general surgery; hypotension; inferior vena cava; logistic models; propofol; ultrasonography
INTRODUCTION
Point of care ultrasound (POCUS) and focused cardiac ultrasound are considered the 21st century stethoscopes with the unparalleled diagnostic modality as they provide real time, dynamic assessment of patient hemodynamics. They are portable and affordable, with a low radiation risk; its reproducibility adds enormous benefits in clinical decision making in the perioperative period. The Society of Critical Care Medicine and American Society of Echocardiography have developed POCUS guidelines for usage across a wide range of clinical settings including the perioperative period [1,2].
Post-induction hypotension (PIH) is the most prevalent hemodynamic alteration because of the cardiovascular depressant and vasodilatory effects of anesthetic agents at induction before surgical stimulation. PIH is categorized into early PIH and early intraoperative hypotension as occurring in the initial 20 minutes and 30 minutes post-induction period, with reported incidences of 18.1% and 24.7%, respectively [3].
Patients with inadequate volume reserve before induction of anesthesia, older age, known hypertensives and patients of decrease, or diagnosis of diabetes mellitus are highly susceptible to this type of hypotension [4]. Recognition and correction of latent hypovolemia are crucial for safe anesthesia practice. Anesthetists generally assess static hemodynamic modalities such as blood pressure, heart rate (HR) variability, central venous pressure, and pulmonary artery occlusion pressure are used for early detection of this entity. However, neither pressure nor volume measures of cardiac preload can accurately predict accurately this event [5]. This is the reason why a dynamic approach has evolved over the years to assess and treat this preload responsiveness to fluids to and ameliorate this hypotension [6,7]. The American Society of Echocardiography and other European Cardiologic Societies have advocated its use in such scenarios [1,2]. As still there is inconclusive evidence in literature about its benefits in predicting preoperative volume status, hence the study was planned to elucidate the role of left ventricular outflow tract velocity time integral (LVOT-VTI) and inferior vena cava collapsibility index (IVC-CI) measurements in preoperative patients for accurately determining PIH after general anesthesia.
MATERIALS AND METHODS
This prospective observational study was conducted from January 1, 2022 to December 31, 2022, after approval from the Institutional Ethics Committee of Indira Gandhi Medical College Shimla (No. HFW(MC-11)B(12) Ethics/2021/24705) and registered the study in the clinical trial registry of India (CTRI no-2021/12/050142). The study conformed to the Standards for Reporting Diagnostic accuracy studies (STARD) checklist and the principles of the Declaration of Helsinki, 2013 guidelines. The study protocol was explained to the patients to the patients, and written informed consent to participate in the study and for the use of data in was obtained for inclusion in the study and later research and publication of the data hence obtained was obtained from all patients.
Patients aged 30–60 years of American Society of Anesthesiologists physical status (ASA-PS) I or II scheduled for elective surgery under general anesthesia with accessible epigastric and thoracic region were assessed for eligibility in the preanesthetic check-up. Patients of ASA-PS ≥III; with inaccessibility of examination site; or with any underlying respiratory distress, cardiac illnesses like heart failure, valvular disease, carotid stenosis, high intra-abdominal pressure, Mallampati score ≥3, non-visualization of study parameters, or preoperative hypotension (systolic blood pressure [SBP] <90 mm Hg) or hypertension (diastolic blood pressure [DBP] >100 mm Hg) were excluded.
Reich et al. [8] reported an incidence of 9% severe hypotension in the 10 minutes directly post-induction. The total number of major surgeries performed in our institution in 2021 were 15,510. Population size (for finite population correction factor or fpc) (n): 15,510; hypothesized % frequency of outcome factor in the population (p): 9%±5%; design effect (for cluster surveys-DEFF): 1; confidence limits as % of 100 (absolute ±%) (d): 90%. The final calculated sample size using OpenEpi (version 3, open source calculator—SSPropor) was 89.
Sample size n=[DEFF×Np(1–p)]/[(d2/Z21-α/2×(n-1)+p×(1–p)]
As we anticipated the exclusion of some patients from the final analysis due to various unavoidable factors, 100 patients were enrolled in the study [8].
In the pre-anesthesia check-up, a thorough history and general physical examination was done. The study protocol and the ultrasonographic (USG) procedure was explained to the patient or relatives and informed consent was taken. The patients were kept fasting for a minimum of fasted for 6 hours and they received tablet alprazolam 0.5 mg as a tablet at bedtime and 0.25 mg 2 hours prior to the surgery. Initial measurements of indices were conducted under the supervision of a senior cardiologist; measurements were repeated in the preoperative area 15 minutes before the surgery. The conscious and spontaneously breathing patients were placed in the dorsal recumbent position for baseline measurements of transthoracic or abdominal ultrasonography. The baseline SBP, DBP, mean arterial pressure (MAP), and HR were recorded. USG imaging was performed using a Sonosite Micromax USG. LVOT-VTI was measured with a low-frequency (2–5 MHz) cardiac probe. LVOT-VTI was obtained by tracing the envelope of the Doppler spectrum of LVOT systolic flow from the apical five- or three chamber views at approximately 2 mm below the aortic annulus using pulsed-wave Doppler, with the sample volume placed within the LVOT, approximately 1 cm off the aortic valve. The stroke volume (SV) was obtained as the from the product of the LVOT cross-sectional area (in cm2) with and the LVOT velocity time integral or VTI (also known as stroke distance, in cm). For IVC diameters, the low-frequency (2–5 MHz) curvilinear probe was placed transversely, and the IVC was visualized in B mode from a paramedian subxiphoid view. After good visualization of the IVC into the right atrium, the probe was placed longitudinally at 1–2 cm from the midline. The last section of the vein, which is proximal to the hepatic vein inflow and 2–3 cm from the right atrium, was selected for M-mode, and measurements were performed as recommended in the consensus document of the American and European Cardiologic Societies. Both end-inspiratory (iIVCD) and end-expiratory (eIVCD) inferior vena cava diameters were measured and recorded in patients with in normal breathing patients during the same respiratory cycle. The IVC collapsibility index (IVCCI) was calculated using the following equation:
In the operation theatre, intravenous fluid was started after securing an 18-G cannula on the dorsum of the hand, and all patients were monitored continuously with non-invasive blood pressure monitoring, ECG, pulse oximetry and capnography. After preoxygenation with 100% oxygen using facemask, fentanyl (2 µg/kg) was given and patients were induced using propofol (2 mg/kg lean body weight) and atracurium (0.5 mg/kg body weight). Intubation was performed by an anesthetist of minimum of 5 years’ experience. Patients who required airway instrumentation with more than one attempt or failed endotracheal intubation due to a difficult intubation were excluded from further data analysis because of excessive stimulation which could hamper the hemodynamic variables and affect the final analysis. SBP, DBP, MAP, and HR were recorded every minute for 4 minutes postinduction but before tracheal intubation and then every 2 minutes till 20 minutes post-intubation. Episodes of hypotension in the period after induction of anesthesia was defined as more than 20% decrease in MAP from baseline or any recorded period of MAP less than 65 mm Hg. Prolonged hypotension or 2 minutes was treated using intravenous boluses of 100 ml fluid or Mephentermine (6 mg) and was recorded. Atropine (0.5 mg) was used for significant bradycardia (HR less than 50 beats/min). Three consecutive readings were performed, and the mean of the three readings was determined.
The data entry was done in the Microsoft Excel spreadsheet and the final analysis was done with the use of IBM SPSS software ver. 25.0 (IBM Corp.). For statistical significance, P-value of less than 0.05 was considered statistically significant. The presentation of the categorical variables was done in the form of number and percentage (%). On the other hand, the quantitative data were presented as the means±standard deviation (SD) and as median with 25th and 75th percentiles (interquartile range [IQR]). The data normality was checked by using Kolmogorov-Smirnov test. The cases in which the data were entered into a Excel, performed with ver. 25.0. The association of the variables which were quantitative and not normally distributed in nature were analyzed using Mann-Whitney test and variables which were quantitative and normally distributed in nature were analyzed using independent t-test. The association of the variables which were qualitative in nature were analyzed using chi-square test. If any cell had an expected value of less than 5 then Fisher’s exact test was used. Receiver operating characteristic (ROC) curve was used to find cutoff point, sensitivity, specificity, positive predictive value, and negative predictive value of IVC-CI and LVOT-VTI for predicting hypotension. DeLong test was used for comparison of area under curve of IVC-CI and LVOT-VTI. Spearman rank correlation coefficient was used for correlation of IVC-CI and LVOT-VTI. Multivariate logistic regression was used to find out independent risk factors of hypotension.
RESULTS
One hundred and ten patients were assessed for the study and 10 were excluded and thus final analysis was done on 100 patients (Figure 1). The mean age in years of the remaining 100 participants was 46.2±9.8 and there were 35 male (35.0%) and 65 female (65.0%) in the study. The mean value of IVC-CI of study subjects was 40.5±8.4, and median (IQR) was 37.7 (33.8–45.7). Mean value of LVOT-VTI of study subjects was 17.9±1.18 with median (IQR) of 18.1 (16.9–19.0) (Table 1).
In the hemodynamic parameters, the HR at baseline was 80.1±11.1, with median (IQR) of 78.5 (74–88) and range of 54–118. The mean value increased at 1 minute post-intubation to 85.1±11.07 and thereafter showed decreasing trend with range of 58–112 beats/min. The MAP (mm Hg) at baseline was 94.3±8.4 with median and IQR of 95 (87–101) and range of 75–109. It decreased post-induction to 84.6±10.5 at 4 minutes and after intubation showed a rising trend with range of 51–107 mm Hg at various recorded time intervals (Figure 2).
The incidence of hypotension in the study was 24%. In the ROC curve analysis, the area under the curve (AUC) was 0.85 for LVOT-VTI and 0.61 for IVC-CI at 95% CI of 0.044–0.422 (P=0.016). The cutoff value for correctly predicting hypotension for LVOT-VTI and IVC-CI was ≤17.45 and >51.5 respectively (Table 2, Figure 3). In the spearman rank correlation coefficient, the two techniques were showing correlation coefficient of 0.142 (P=0.308).
The association of comorbidities, ASA-PS, LVOT-VTI, IVC-CI, and hemoglobin was compared amongst the group with and without PIH. Baseline hemoglobin, hypertension, obesity (body mass index >33 kg/m2), LVOT-VTI <17.45, and IVC-CI >51.5 were significantly associated with PIH (Table 3). In the multivariate regression analysis only IVC-CI and LVOT-VTI were significant independent risk factors of hypotension after adjusting for confounding factors (P≤0.025) (Table 4).
DISCUSSION
The pharmacological effects of induction agents may be exaggerated in the form of PIH, more so in patients with latent hypovolemia and comorbidities, leading to increased morbidity and mortality in the postoperative phase. Thus, recognition and correction of hypovolemia in the preoperative period can reduce the incidence of organ dysfunction that may ensue. Despite the improvement in preoperative practices worldwide, involving avoidance of unnecessary fasting and mechanical bowel preparation, optimized fluid therapy remains the cornerstone of treatment and shows excellent effectiveness [4]. However, fluid therapy can be a double-edged sword with deleterious effects both with under or overcorrection. Therefore, reliable sensitive and specific indicators are needed to identify patients needing the fluids in the preoperative period.
The measurement of LVOT-VTI was initially used in patients with right heart failure after pulmonary thrombus, thereafter its use was extended to patients with sepsis and shock in the intensive care unit (ICU) with limited studies on its correlation in elective surgery. Similarly, the use of IVC-CI in such scenarios is still controversial. Since both the techniques are noninvasive and easily performed by anesthetists, hence its use cannot be overruled till the advent of other techniques. Hence, the study was planned to see its sensitivity, specificity, accuracy, and its correlation with hypotension in patients undergoing routine surgery under general anesthesia.
In our study, the discriminatory power of LVOT-VTI with the AUC was 0.853 (95% CI, 0.769–0.916; P<0.001) with a sensitivity of 83.3% (95% CI, 62.6%–95.3%) and specificity of 80.3% (95% CI, 69.5%–88.5%). The positive predictive value was found to be 57.1% (95% CI, 39.4%–73.7%) and negative predictive value of 93.8% (95% CI, 85.0%–98.3%). LVOT-VTI was the predictor of hypotension with cutoff point of ≤17.45 for correctly predicting hypotension.
Since sensitivity and specificity are always trade-offs (any increase in sensitivity was be accompanied by a decrease in specificity), so we selected the variable with the combination of sensitivity and specificity that gave the highest predictive value, or maximum AUC. Aissaoui et al. [9] and Wang et al. [10] found good accuracy of 89%–95% with LVOT-VTI. The reported AUC was 0.89 (95% CI, 0.80–0.97) with a cutoff value of 18% (sensitivity, 88%; specificity, 84%) in patients undergoing abdominal surgery while Wang et al. [10] took LVOT-VTI cutoff of 15.9% in septic shock patients on ventilators (AUC, 0.95; sensitivity, 87.5%; specificity, 95%) [9,10].
In our study, the AUC was 0.613 (95% CI, 0.509–0.710; P=0.120) with positive predictive value, negative predictive value, sensitivity, specificity of 58.3% (95% CI, 13.2%–4.8%), 81.4% (95% CI, 71.6%–89.0%), 30.4% (95% CI, 13.2%–52.9%), and 93.3% (95% CI, 85.1%–97.8%), respectively, and the cutoff value of IVC-CI for predicting hypotension was >51.5. Szabó et al. [11] reported an IVCCI cutoff value of 50%, AUC of 64.8% (95% CI, 52.1%–77.5%), suggesting a mediocre to good diagnostic accuracy (sensitivity, 45.5%; specificity, 90%) and Zhang and Critchley [12] took cutoff value of 43% (AUC, 0.9; 95% CI, 0.82–0.95) in predicting hypotension in patients undergoing general anesthesia [11]. Airapetian et al. [13] took an IVC-CI cutoff value of >42 in predicting patients who will be fluid responders in ICU with a sensitivity and specificity of 31% and 97%, respectively. Singh et al. [14] measured it in parturient patient undergoing spinal block and it was 25.5 cutoff (sensitivity, 60.9%; specificity, 35.5%), while Salama and Elkashlan [15] took 44.7% cutoff for predicting post-spinal hypotension in their patients (accuracy, 84%; sensitivity, 84%; specificity, 77%). Thus, all the studies have reported slightly different values ranging between 40%–50% cutoff values which could be as the patients included and technique of anesthesia were different.
In our study, the IVC-CI has a substantially lower AUC than LVOTVTI. LVOT-VTI was the best predictor of hypotension (P=0.02) with a correlation value of 0.142 (P=0.308). Aissaoui et al. [9] also simultaneously studied these two indices in his study and found that IVC-CI poorly predicted the hypotension over LVOT-VTI. In the study, the initial few measurements were done under the supervision of sonologist and cardiologist. Dinh VA et al. [16] had concluded that LVOT-VTI measurements can be accurately done by emergency physician (ED) and were optimal in 90.0% (95% CI, 82.6%–94.5%) over 91.3% (73.2%–97.6%) in those done by sonographer. The correlation (r) for CI between ED physician and sonographer was 0.82 (0.60–0.92), with bias and limits of agreement of –0.11 L/min/m2 (–1.06 to 0.83) and percent difference of 12.4%±10.1% [16]. Blanco [5] in the review article had concluded that the VTI and minute distance are simple, feasible and reproducible measurements to serially track the SV and cardiac output.
In the study, IVC was poorly visualized in 10 patients (10%), while the LVOT-VTI measurements were possible in all the patients. Szabó et al. [11], Zhang and Critchley [12], and Hutchings and Rees [17] reported a similar failure rate of 7%–15% in their respective studies for IVC-CI measurements. Bergenzaun et al. [18] also reported a good repeatability of 95% with LVOT-VTI in their study.
The mean value of IVC-CI and LVOT-VTI was 40.53 and 8.42 and 17.94 and 1.18, respectively in the study with 24.0% incidence of PIH in patients. Similar results were reported by Sudfeld et al. [3] and Nega et al. [19] who reported incidence of 18.1% to 26.95% in their respective studies. Sudfeld et al. [3] further subdivided this hypotension into PIH (occurring within 20 minutes of induction) and early intraoperative hypotension occurring within 30 minutes of surgery with incidence of 18.1% and 24.7% with 8.9% of patients having both types of hypotension. Aissaoui et al. [9], Szabó et al. [11], Singh et al. [14], and Salama and Elkashlan [15] reported higher incidence of PIH being 39.6%,51%, 45%, and 57.5%, respectively.
The demographic parameters of age, sex, weight, and some comorbidities were comparable in patients with and without PIH. Preoperative hypertension, obesity, LVOT-VTI <17.5 and IVC-CI >51.5 were associated significantly with hypotension but in multivariate linear regression only LVOT-VTI and IVC-CI had significant correlation with post induction hypotension with adjusted odds ratio of 8.491 (95% CI, 1.301–55.414; P=0.025) and 17.427 (95% CI, 4.422–68.672; P<0.001), respectively. On the contrary, Sudfeld et al. [3], Szabó et al. [11], Zhang and Critchley [12], and Salama and Elkashlan [15] reported higher age (their patients were above 55 years of age), to play a significant role in the development of post-induction hypotension (P<0.05). In the study, ASA II patients had 46% incidence of PIH over 16% in ASA I patients like Sudfeld et al. [3] who too observed more incidence of hypotension in ASA II patients. Szabó et al. [11], Zhang and Critchley [12], and Salama and Elkashlan [15] found nonsignificant association between ASA grading and PIH.
The major limitations of this observational study were that blinding or randomization was not done and the serial USG monitoring was not attempted as it would have interfered with the surgery. Hence, the effect of fluid challenges or fluid responsiveness on IVC or LVOT-VTI variability was not assessed. The expertise of the anesthesiologists for recording these measurements is another limitation. Ever since the POCUS has become available, its use is routinely done by anesthesiologists, hence the expertise and use is increasing day by day. The ideal condition advocated for these measurements is a mechanically ventilated patient in sinus rhythm, so most of the studies done are on patients in ICU settings. Researchers have extrapolated its use in emergency scenarios for fluid responsiveness hence its routine use is indicated to improve patient’s outcome. The major advantage of the study was that we measured the two dynamic parameters simultaneously in the patients to compare the diagnostic accuracy.
The use of preoperative POCUS for measurement of LVOT-VTI or IVC-CI to predict PIH is advocated, to decrease the morbidity of the patient’s undergoing surgery. Amongst these two techniques, we recommend LVOT-VTI as it has better diagnostic accuracy (77.4%) with no failure rate.
KEY MESSAGES
The non-invasive dynamic tools left ventricular outflow tract velocity time integral and inferior vena cava collapsibility index have good diagnostic accuracy for predicting post-induction hypotension.
NOTES
-
CONFLICT OF INTEREST
No potential conflict of interest relevant to this article was reported.
-
FUNDING
None.
-
AUTHOR CONTRIBUTIONS
Conceptualization: AS (Arti Sharma), JP. Methodology: AS (Arti Sharma), JP. Formal analysis: VS, JP. Data curation: VS, AST (Arvind Sethi), JP. Visualization: VS, (Arvind Sethi), JP. Project administration: AS (Arti Sharma), AST (Arvind Sethi), JP. Writing–original draft: all authors. Writing–review & editing: all authors.
Acknowledgments
None.
Figure 1.Flow diagram for the patient selection ASA: American Society of Anesthesiologists; POCUS: point of care ultrasound; SBP: systolic blood pressure; DBP: diastolic blood pressure.

Figure 2.Descriptive statistics of heart rate (A) and mean arterial pressure (B) of study subject.
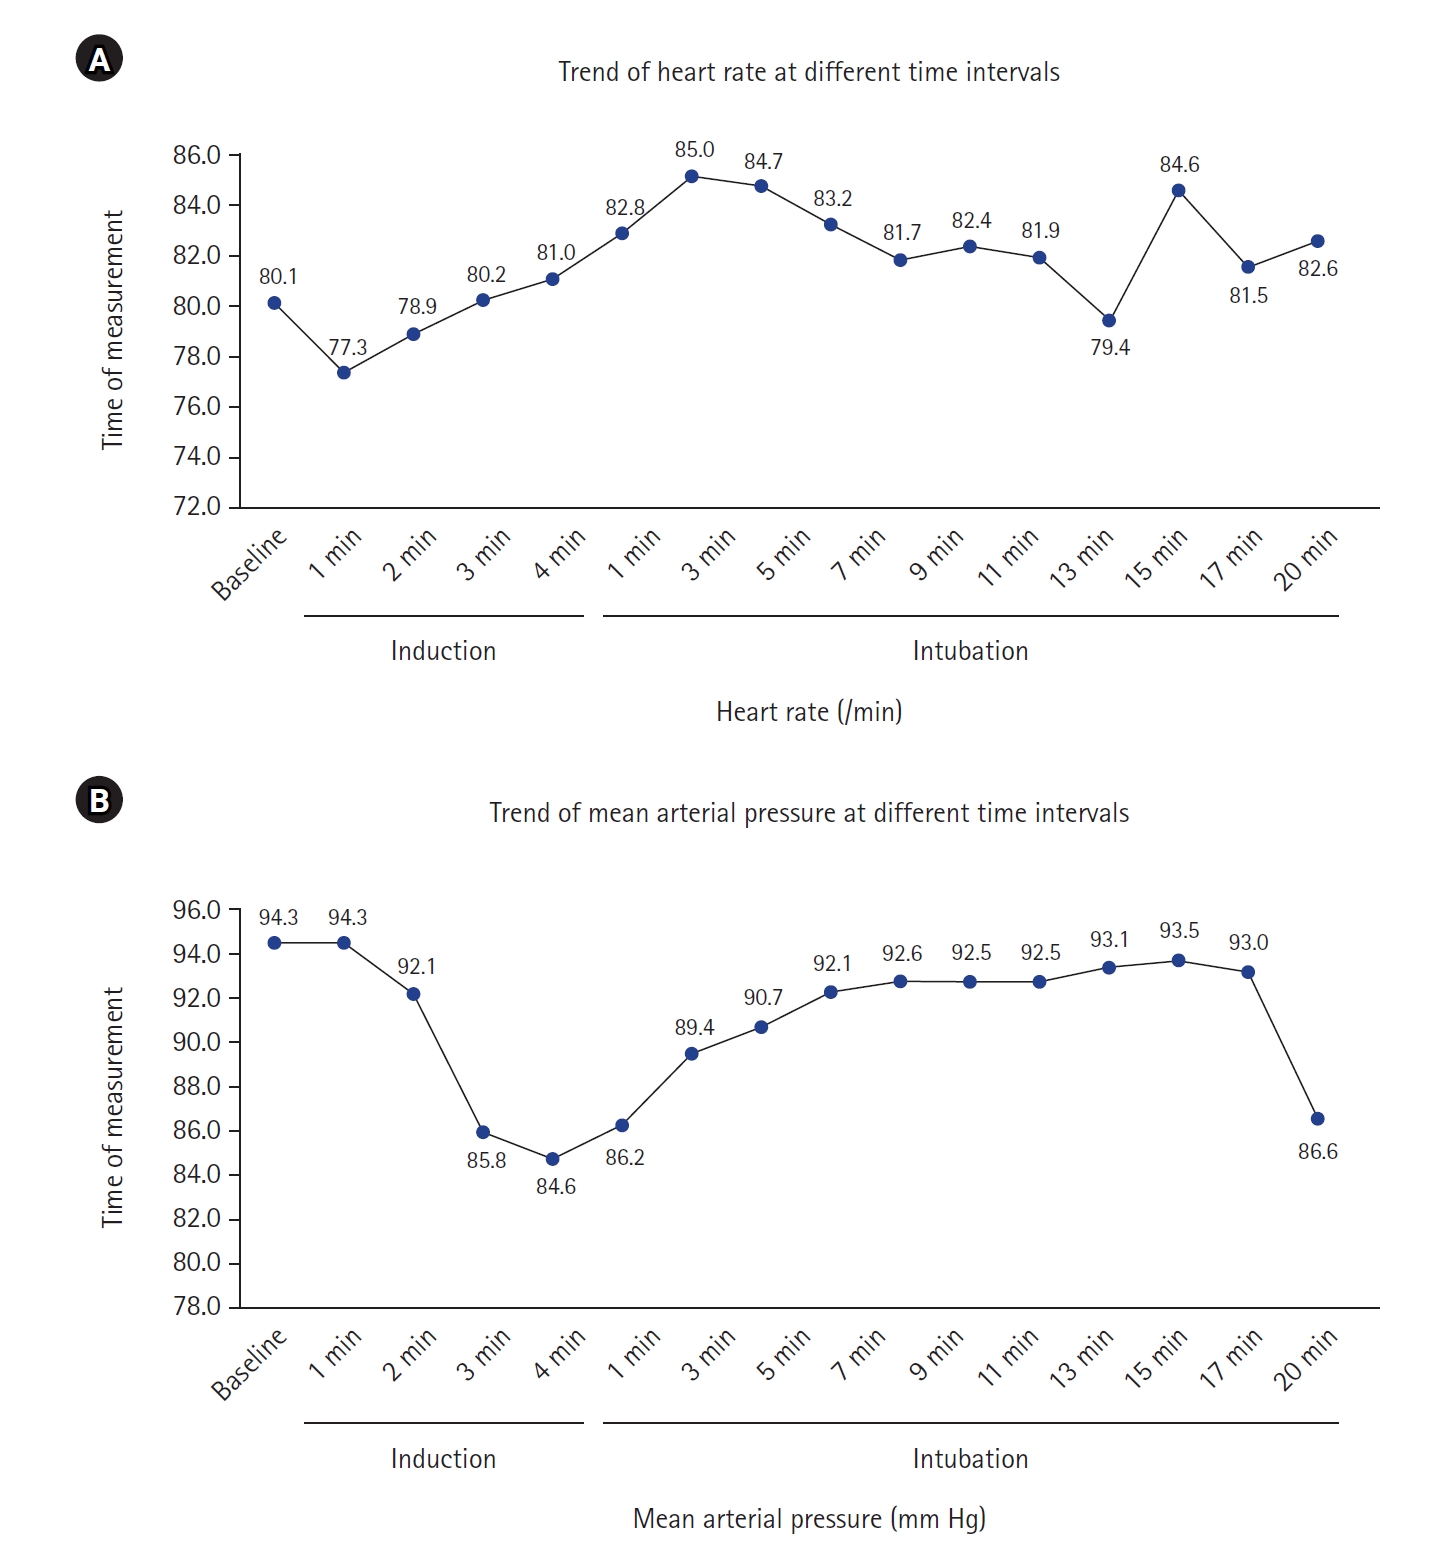
Figure 3.(A) Receiver operating characteristics (ROC) of inferior vena cava collapsibility index (IVC-CI). (B) ROC of left ventricular outflow tract velocity time integral (LVOT-VTI). (C) Comparison of area under the curve (AUC) of IVC-CI and LVOT-VTI. (D) Correlation between IVC-CI and LVOT-VTI. Spearman rank correlation coefficient.
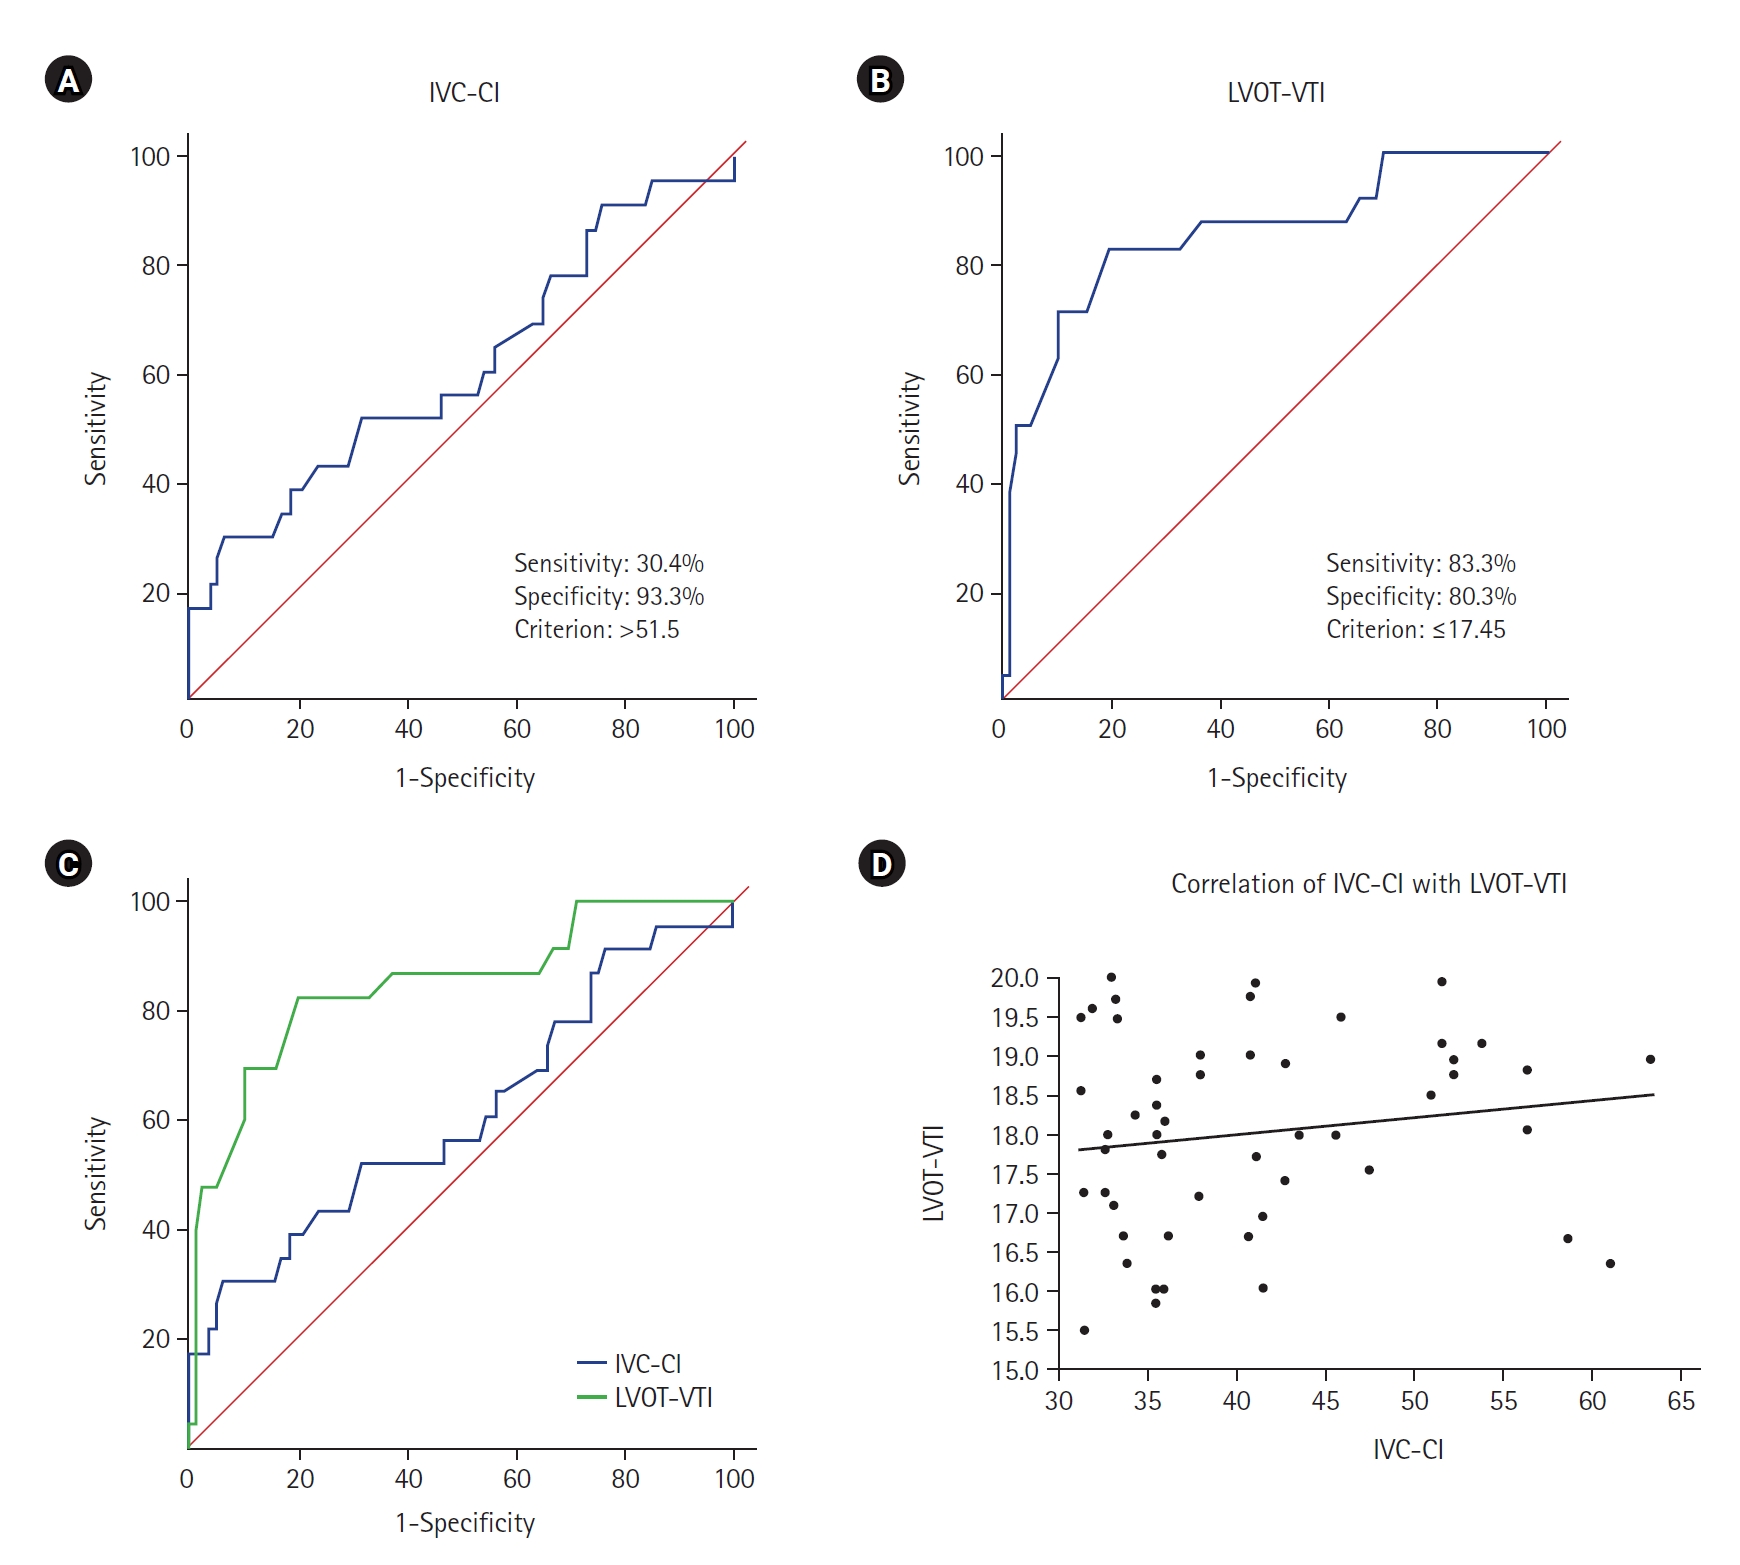
Table 1.Demographic profile and other parameters and clinical characteristics of patients
|
Characteristic |
Mean±SD |
Median (IQR) |
Range |
|
Age (yr) |
46±10 |
45 (40–54) |
30–60 |
|
Height (m) |
1.7±0.1 |
1.6 (1.6–1.7) |
1.5–1.9 |
|
Weight (kg) |
61.9±10.8 |
60.0 (55.0–65.0) |
45.0–105.0 |
|
Body mass index (kg/m²) |
22.4±4.1 |
21.9 (19.5–24.0) |
16.1–37.6 |
|
Hemoglobin (g/dl) |
12.7±1.2 |
12.5 (12.0–13.2) |
9.2–15.5 |
|
Propofol used (mg) |
105.1±14.8 |
100.0 (100.0–120.0) |
80.0–150.0 |
|
IVC-CI |
40.5±8.4 |
37.7 (33.8–45.7) |
30.8–69.0 |
|
LVOT-VTI |
17.9±1.2 |
18.1 (16.9–19.0) |
15.3–20.0 |
Table 2.Receiver operating characteristic curve of IVC-CI and LVOT-VTI for predicting hypotension
|
Variable |
IVC-CI |
LVOT-VTI |
|
AUC |
0.613 |
0.853 |
|
SE |
0.073 |
0.049 |
|
95% CI |
0.509–0.710 |
0.769–0.916 |
|
P-value |
0.120 |
<0.001 |
|
Difference between areas |
0.233 |
|
SE |
0.097 |
|
95% CI |
0.044–0.422 |
|
P-value |
0.016a)
|
|
Cutoff |
>51.5 |
≤17.45 |
|
Sensitivity (95% CI, %) |
30.4 (13.2–52.9) |
83.3 (62.6–95.3) |
|
Specificity (95% CI, %) |
93.3 (85.1–97.8) |
80.3 (69.5–88.5) |
|
PPV (95% CI, %) |
58.3 (27.7–84.8) |
57.1 (39.4–73.7) |
|
NPV (95% CI, %) |
81.4 (71.6–89.0) |
93.8 (85.0–98.3) |
|
Diagnostic accuracy (%) |
73.6 |
77.4 |
Table 3.Associations of comorbidities and other parameters with hypotension
|
Serial No. |
Parameter |
Patients with hypotension (n=24) |
Patients without hypotension (n=76) |
Total |
P-value |
|
1 |
Asthma |
0 |
2 (2.6) |
2 (2.0) |
1.000 |
|
2 |
Diabetes mellitus |
4 (16.7) |
4 (5.3) |
8 (8.0) |
0.090 |
|
3 |
Hypertension |
6 (25.0) |
5 (6.6) |
11 (11.0) |
0.012 |
|
4 |
COPD |
3 (12.5) |
3 (4.0) |
6 (6.0) |
0.148 |
|
5 |
Obese |
3 (12.5) |
1 (1.3) |
4 (4.0) |
0.042 |
|
6 |
Overweight |
1 (4.2) |
0 |
1 (1.0) |
0.240 |
|
7 |
Hypothyroid |
2 (8.3) |
2 (2.6) |
4 (4.0) |
0.243 |
|
8 |
Anemic |
1 (4.2) |
0 |
1 (1.0) |
0.240 |
|
9 |
ASA I grade |
12 (50.0) |
62 (81.6) |
74 (74.0) |
0.002 |
|
ASA II grade |
12 (50.0) |
14 (18.4) |
26 (26.0) |
|
10 |
Hemoglobin (g/dl) |
12.2±1.3 |
12.8±1.1 |
12.7±1.2 |
0.035 |
|
Median (IQR) |
12.2 (11.6–12.7) |
12.8 (12.0–13.2) |
12.5 (1.0–13.2) |
|
Range |
9.2–14.6 |
9.8–15.5 |
9.2–15.5 |
|
11 |
IVC-CI ≤51.5 |
17 (70.8) |
71 (93.4) |
88 (88.0) |
0.003 |
|
IVC-CI >51.5 |
7 (29.2) |
5 (6.6) |
12 (12.0) |
|
|
Mean±SD |
44.1±11.3 |
39.4±7.1 |
40.5±8.4 |
0.102 |
|
Median (IQR) |
41.5 (35.4–52.5) |
37.5 (33.5–44.2) |
37.7 (33.8–45.7) |
|
Range |
30.8–69.0 |
31.1–56.4 |
30.8–69.0 |
|
12 |
LVOT-VTI ≤17.45 |
20 (83.3) |
15 (19.7) |
35 (35.0) |
<0.001 |
|
LVOT-VTI >17.45 |
4 (16.7) |
61 (80.3) |
65 (65.0) |
|
Mean±SD |
16.8±1.0 |
18.3±1.0 |
17.9±1.2 |
<0.001 |
|
Median (IQR) |
16.6 (16.1–17.3) |
18.4 (17.6–19.1) |
18.1 (16.9–19.0) |
|
Range |
15.3–19.0 |
15.5–20.0 |
15.3–20.0 |
Table 4.Multivariate logistic regression to identify independent risk factors of hypotension
|
Variable |
Beta coefficient |
SE |
P-value |
OR |
95% CI |
|
Hemoglobin (g/dl) |
–0.397 |
0.249 |
0.110 |
0.672 |
0.413–1.094 |
|
Hypertension |
0.938 |
0.943 |
0.320 |
2.555 |
0.403–16.220 |
|
Obese |
1.414 |
1.839 |
0.442 |
4.111 |
0.112–151.193 |
|
1 |
|
|
|
1.000 |
|
|
2 |
0.530 |
0.737 |
0.473 |
1.698 |
0.400–7.205 |
|
IVC-CI ≤51.5 |
|
|
|
1.000 |
|
|
IVC-CI >51.5 |
2.139 |
0.957 |
0.025 |
8.491 |
1.301–55.414 |
|
LVOT-VTI >17.45 |
|
|
|
1.000 |
|
|
LVOT-VTI ≤17.45 |
2.858 |
0.700 |
<0.001 |
17.427 |
4.422–68.672 |
References
- 1. Kalagara H, Coker B, Gerstein NS, Kukreja P, Deriy L, Pierce A, et al. Point-of-care ultrasound (POCUS) for the cardiothoracic anesthesiologist. J Cardiothorac Vasc Anesth 2022;36:1132-47.ArticlePubMed
- 2. Spencer KT, Kimura BJ, Korcarz CE, Pellikka PA, Rahko PS, Siegel RJ. Focused cardiac ultrasound: recommendations from the American Society of Echocardiography. J Am Soc Echocardiogr 2013;26:567-81.ArticlePubMed
- 3. Südfeld S, Brechnitz S, Wagner JY, Reese PC, Pinnschmidt HO, Reuter DA, et al. Post-induction hypotension and early intraoperative hypotension associated with general anaesthesia. Br J Anaesth 2017;119:57-64.ArticlePubMed
- 4. Jor O, Maca J, Koutna J, Gemrotova M, Vymazal T, Litschmannova M, et al. Hypotension after induction of general anesthesia: occurrence, risk factors, and therapy: a prospective multicentre observational study. J Anesth 2018;32:673-80.ArticlePubMedPDF
- 5. Blanco P. Rationale for using the velocity-time integral and the minute distance for assessing the stroke volume and cardiac output in point-of-care settings. Ultrasound J 2020;12:21. ArticlePubMedPMCPDF
- 6. Desai N, Garry D. Assessing dynamic fluid-responsiveness using transthoracic echocardiography in intensive care. BJA Educ 2018;18:218-26.ArticlePubMedPMC
- 7. Benes J, Kirov M, Kuzkov V, Lainscak M, Molnar Z, Voga G, et al. Fluid therapy: double-edged sword during critical care? Biomed Res Int 2015;2015:729075. ArticlePubMedPMCPDF
- 8. Reich DL, Hossain S, Krol M, Baez B, Patel P, Bernstein A, et al. Predictors of hypotension after induction of general anesthesia. Anesth Analg 2005;101:622-8.ArticlePubMed
- 9. Aissaoui Y, Jozwiak M, Bahi M, Belhadj A, Alaoui H, Qamous Y, et al. Prediction of post-induction hypotension by point-of-care echocardiography: a prospective observational study. Anaesth Crit Care Pain Med 2022;41:101090. ArticlePubMed
- 10. Wang J, Zhou D, Gao Y, Wu Z, Wang X, Lv C. Effect of VTILVOT variation rate on the assessment of fluid responsiveness in septic shock patients. Medicine (Baltimore) 2020;99:e22702.ArticlePubMedPMC
- 11. Szabó M, Bozó A, Darvas K, Horváth A, Iványi ZD. Role of inferior vena cava collapsibility index in the prediction of hypotension associated with general anesthesia: an observational study. BMC Anesthesiol 2019;19:139. PubMedPMC
- 12. Zhang J, Critchley LA. Inferior vena cava ultrasonography before general anesthesia can predict hypotension after induction. Anesthesiology 2016;124:580-9.ArticlePubMedPDF
- 13. Airapetian N, Maizel J, Alyamani O, Mahjoub Y, Lorne E, Levrard M, et al. Does inferior vena cava respiratory variability predict fluid responsiveness in spontaneously breathing patients? Crit Care 2015;19:400. ArticlePubMedPMCPDF
- 14. Singh Y, Anand RK, Gupta S, Chowdhury SR, Maitra S, Baidya DK, et al. Role of IVC collapsibility index to predict post spinal hypotension in pregnant women undergoing caesarean section: an observational trial. Saudi J Anaesth 2019;13:312-7.ArticlePubMedPMC
- 15. Salama ER, Elkashlan M. Pre-operative ultrasonographic evaluation of inferior vena cava collapsibility index and caval aorta index as new predictors for hypotension after induction of spinal anaesthesia: a prospective observational study. Eur J Anaesthesiol 2019;36:297-302.PubMed
- 16. Dinh VA, Ko HS, Rao R, Bansal RC, Smith DD, Kim TE, et al. Measuring cardiac index with a focused cardiac ultrasound examination in the ED. Am J Emerg Med 2012;30:1845-51.ArticlePubMed
- 17. Hutchings SD, Rees PS. Trauma resuscitation using echocardiography in a deployed military intensive care unit. J Intensive Care Soc 2013;14:120-5.ArticlePDF
- 18. Bergenzaun L, Gudmundsson P, Öhlin H, Düring J, Ersson A, Ihrman L, et al. Assessing left ventricular systolic function in shock: evaluation of echocardiographic parameters in intensive care. Crit Care 2011;15:R200. ArticlePubMedPMC
- 19. Nega MH, Ahmed SA, Tawuye HY, Mustofa SY. Incidence and factors associated with post-induction hypotension among adult surgical patients: prospective follow-up study. Int J Surg Open 2022;49:100565. Article
Citations
Citations to this article as recorded by


 , Arti Sharma

 PubReader
 ePub Link
 Cite
Cite


